這幾天客戶反應連我們的系統使用者體驗不好,白話一點就是反應時間很長吧 ~
這時候就去查了一下客戶反應的 API 與其 API 工作原理,發現他需要與客戶的系統做一個介接,所以就用 cURL 查一下,發現預設版本的 cURL 資訊不夠需要做一點設定,所以就出現這篇文拉 ~
如下圖為幾個常用的 cURL command 與加強版的 cURL command,下面會來慢慢介紹這些指令分別的差異。
This file contains hidden or bidirectional Unicode text that may be interpreted or compiled differently than what appears below. To review, open the file in an editor that reveals hidden Unicode characters.
Learn more about bidirectional Unicode characters
| clarence:~$ curl https://blog.clarence.tw | |
| clarence:~$ curl -o /dev/null https://blog.clarence.tw | |
| % Total % Received % Xferd Average Speed Time Time Time Current | |
| Dload Upload Total Spent Left Speed | |
| 100 32550 0 32550 0 0 27874 0 --:--:-- 0:00:01 --:--:-- 27892 | |
| clarence:~$ curl -w "@curl-format.txt" https://blog.clarence.tw | |
| clarence:~$ curl -w "@curl-format.txt" -o /dev/null https://blog.clarence.tw | |
| % Total % Received % Xferd Average Speed Time Time Time Current | |
| Dload Upload Total Spent Left Speed | |
| 100 32549 0 32549 0 0 89956 0 --:--:-- --:--:-- --:--:-- 90163 | |
| time_namelookup: 0.004850 | |
| time_connect: 0.018008 | |
| time_appconnect: 0.089712 | |
| time_redirect: 0.000000 | |
| time_pretransfer: 0.089951 | |
| time_starttransfer: 0.346289 | |
| ---------- | |
| time_total: 0.361829 |
在目前的目錄開啟一個文件叫做 curl-format.txt 並把以下的文字放進去
This file contains hidden or bidirectional Unicode text that may be interpreted or compiled differently than what appears below. To review, open the file in an editor that reveals hidden Unicode characters.
Learn more about bidirectional Unicode characters
| \n | |
| time_namelookup: %{time_namelookup}\n | |
| time_connect: %{time_connect}\n | |
| time_appconnect: %{time_appconnect}\n | |
| time_redirect: %{time_redirect}\n | |
| time_pretransfer: %{time_pretransfer}\n | |
| time_starttransfer: %{time_starttransfer}\n | |
| ----------\n | |
| time_total: %{time_total}\n | |
| \n |
- 第一條指令為比較常用的方法,此指令會直接把 GET 到的 HTML 直接吐出來,如果使用的是 API 類型的服務,就會把 JSON 或是 XML 吐出來,其實我個人滿常用的。
- 第二條用 -o 把輸出丟到 /dev/null 也就是黑洞,使用此方法可以即時的看到目前下載的情況。通常 -o 比較常用在下載的情況,如果我今天想要抓某個檔案就會用 -o file
- 第三條要使用到上圖的檔案,用此方法可以看到詳細的連線時間資料
- 第四條是把第二條學到的跟第三條結合的一個方法
以下做一點變數的中文解釋
- time_namelookup:DNS 解析時間,也就是查詢到 IP 的時間
- time_connect:TCP 連線時間,就是 TCP 三項交握的時間
- time_appconnect:SSL 連線的時間
- time_redirect:從開始到最後一個請求的時間,如果網頁有跳轉就會有時間
- time_pretransfer:從開始到響應開始的時間
- time_starttransfer:從開始到響應開始傳輸的時間
- time_total:整體時間
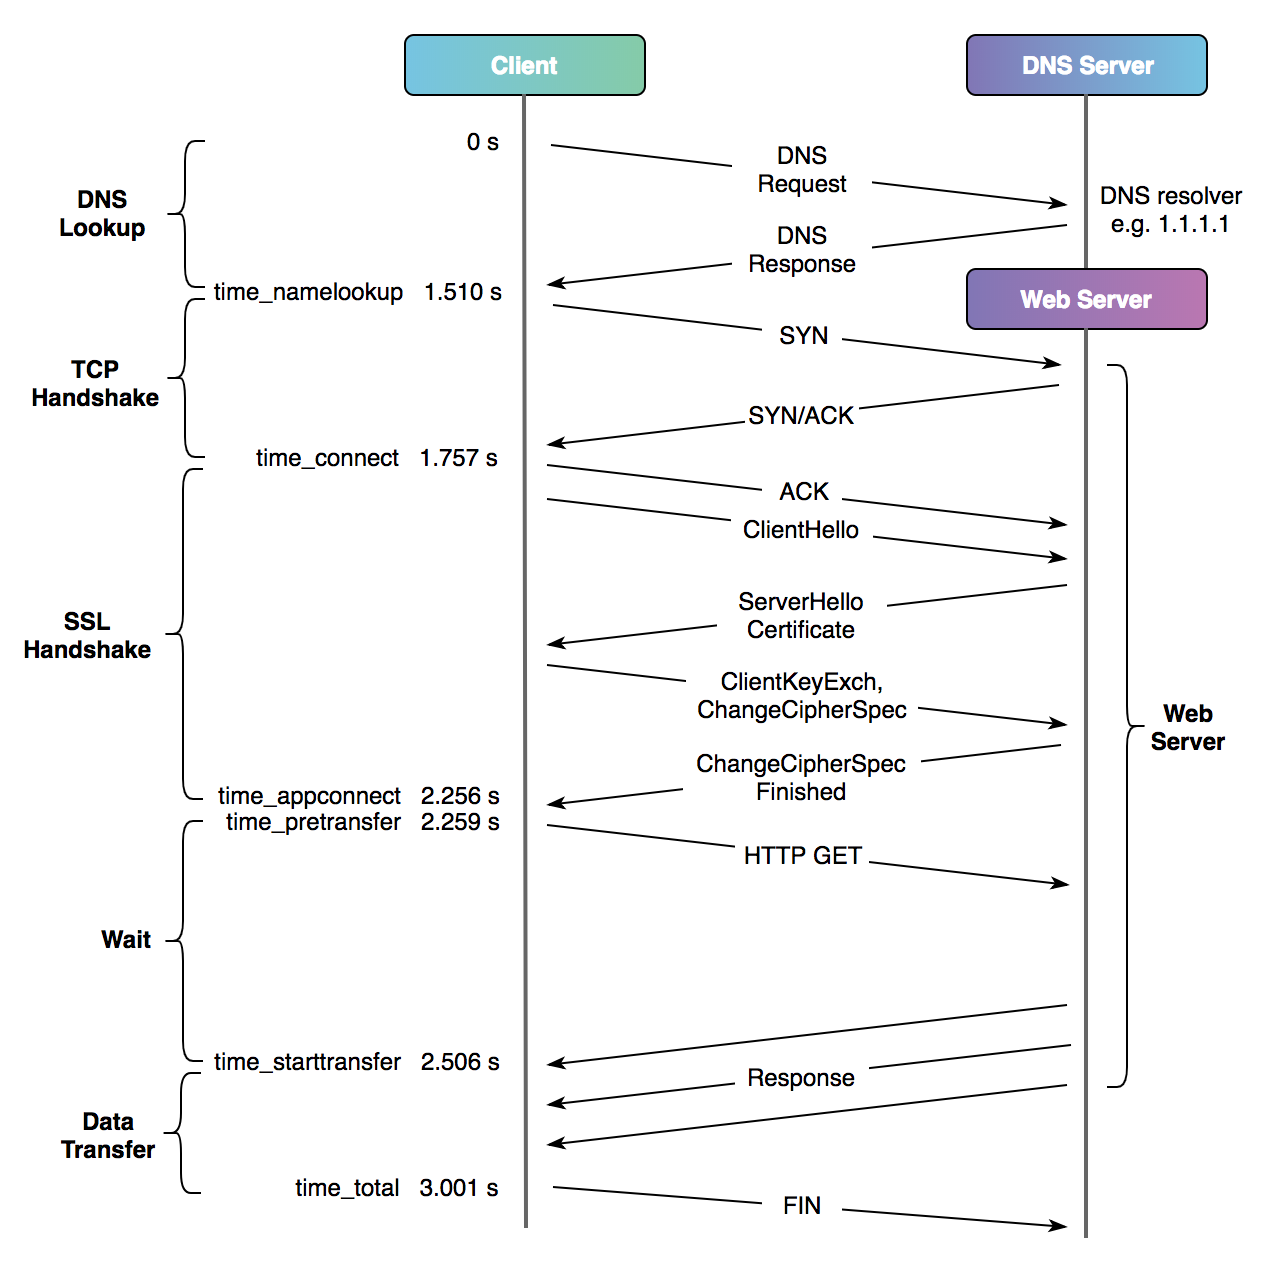
通常我們可能還會再進一步想要得到 TCP 連線時間,SSL 處理時間,Server 處理時間等等就可以用上述數據加以整理
- DNS 查詢使用時間:time_namelookup
- TCP 連線時間:time_pretransfer – time_namelookup
- SSL 處理時間:time_appconnect – time_connect
- Server 處理時間:time_starttransfer – time_pretransfer
- Server 內容傳輸時間:time_total – time_starttransfer
題外話是在測試的過程中發現客戶的 DNS 查詢時間竟然高達 1.5s,看到都要暈倒了 …,又因為如此去查了一下 DNS 發現到 AWS VPC 內的 DNS 有一個神奇的特性,會在下篇告訴大家!
相關網頁